Day 72 & 73 Grafana

🛠️ Exploring DevOps tools: Docker, Kubernetes, Jenkins, Terraform, and more. 🌐Let's connect, learn, and grow together.
Day 72 & 73 of #90daysofdevops
Hey Techies! Welcome to this blog
In this blog, we are going to start with Grafana.
First learn about Observability in DevOps
What is DevOps Observability?
DevOps observability is a set of practices and tools that enable organizations to gain insights into their software development and deployment processes, as well as the performance and health of their applications in real time. The process helps in improving application observability. It focuses on enhancing visibility into various aspects of the software development lifecycle, including development, testing, deployment and operations.
Key Components of DevOps Observability
The key components of DevOps observability typically include:
Monitoring: This involves the collection and analysis of data from various sources, such as logs, metrics and traces, to gain insights into the performance and behaviour of systems. Adopting application performance monitoring tools helps detect and alert on issues, allowing teams to respond quickly to incidents.
Logging: Centralized logging allows organizations to collect and analyze log data generated by different components of their applications. This helps in identifying issues, troubleshooting problems and understanding the flow of data through the system.
Metrics: Metrics provide quantitative data about the performance and behaviour of systems. They can include information on resource utilization, response times error rates and other relevant indicators. Monitoring and analyzing metrics help DevOps & SRE teams understand trends and patterns in the system’s behaviour.
Tracing: Distributed tracing enables organizations to track the flow of requests and transactions across different components of a distributed system. This helps in identifying performance bottlenecks, understanding dependencies and improving the overall system architecture.
Alerting: Setting up alerts based on predefined thresholds or conditions allows teams to be notified when issues occur. Proactive alerting helps in identifying and addressing potential problems before they impact users.
Visualization: Visualization tools provide graphical representations of data, making it easier for teams to understand complex relationships and patterns. Dashboards and charts help in presenting key metrics and performance indicators in a comprehensible manner, thus improving application observability.
DevOps observability is crucial for organizations practising DevOps as it fosters a culture of continuous improvement and collaboration. By incorporating observability practices into the DevOps pipeline, DevOps & SRE teams can achieve faster and more reliable delivery of software while maintaining high levels of performance and availability.
Tools for Enhancing DevOps Observability
Implementing observability in a DevOps environment involves using a combination of tools that cater to monitoring, logging, tracing and visualization. Here are some popular tools in each category:
Monitoring
Prometheus: An open-source monitoring and alerting toolkit designed for reliability and scalability. It is particularly well-suited for dynamic, cloud-native environments.
Grafana: Often used in conjunction with Prometheus, Grafana is an open-source platform for monitoring and observability that provides rich visualizations and dashboards.
Logging
ELK Stack (Elasticsearch, Logstash, Kibana): A popular open-source stack for log management, providing the ability to collect, process, store and visualize log data.
Splunk: A powerful log management and analysis tool that allows organizations to search, monitor and analyze machine-generated data.
Tracing
Jaeger: An open-source, end-to-end distributed tracing system that helps in monitoring and troubleshooting complex, microservices-based architectures.
AWS X-Ray: A distributed tracing service provided by Amazon Web Services (AWS) for application performance monitoring and troubleshooting of issues.
Visualization
Grafana: In addition to its monitoring capabilities, Grafana is widely used for creating customizable dashboards and visualizations.
Kibana: Part of the ELK Stack, Kibana is a powerful open-source visualization tool specifically designed for Elasticsearch data.
Tableau: While not specifically designed for observability, Tableau is a versatile data visualization tool that can be used to create insightful dashboards.
Choosing the right combination of tools depends on your specific requirements, existing technology stack and preferences. Many organizations opt for integrated solutions or a combination of the best-of-the-league tools to cover all aspects of observability in their DevOps pipelines.
Task:
What is Grafana?
Grafana is an open-source analytics and interactive visualization web application. It allows you to ingest data from a huge number of data sources, query this data, and display it on beautiful customizable charts for easy analysis.
It is also possible to set alerts so you can quickly and easily be notified of abnormal behavior and lots more. In simple terms, Grafana allows you to transform the mountain of performance metric data collected from your applications, into visualizations. This will allow you to draw conclusions and make decisions to keep your application stack healthy.
What are the features of Grafana?
Grafana comes with a plethora of features that provide value straight out of the box. These features are the reason Grafana is arguably one of the most popular visualization software available for metric monitoring, simply because of their ease of use:
1. Extensive Data Source Support:
Grafana supports a wide range of data sources, including popular databases like Prometheus, InfluxDB, Elasticsearch, and more. This flexibility allows users to consolidate and visualize metrics from various systems within a unified dashboard.
2. Intuitive Dashboards:
With a user-friendly interface, Grafana facilitates the creation of customizable dashboards. Users can choose from a variety of panels and charts to represent data in a way that suits their specific monitoring needs.
3. Alerting and Notifications:
Grafana provides robust alerting capabilities, allowing users to set up alerts based on specific conditions. Notifications can be sent via various channels, ensuring that critical issues are promptly addressed.
4. Community and Plugin Support:
A vibrant community and a vast repository of plugins contribute to Grafana's extensibility. Users can enhance functionality by integrating plugins for additional data sources, visualizations, and alerting mechanisms.
Why Choose Grafana?
The appeal of Grafana lies in its versatility and adaptability. It caters to a broad spectrum of use cases, from infrastructure monitoring to business intelligence. Its open-source nature, coupled with an active community, ensures continuous improvement and the availability of valuable resources.
What type of monitoring can be done via Grafana?
Grafana supports a wide range of monitoring types, including:
Infrastructure Monitoring: Grafana can be used for monitoring the health and performance of infrastructure components such as servers, databases, and networks.
Application Monitoring: Grafana can be used to monitor application performance metrics such as response time, error rates, and throughput.
Log Monitoring: Grafana can be used to analyze logs and create visualizations of log data to identify trends, patterns, and anomalies.
IoT Device Monitoring: Grafana can be used to monitor and visualize data from IoT devices, such as temperature sensors, humidity sensors, and motion sensors.
Business Metrics Monitoring: Grafana can be used to monitor business metrics such as sales figures, revenue, and customer satisfaction.
What databases work with Grafana?
Grafana seamlessly integrates with databases like:
Prometheus
InfluxDB
Graphite
Elasticsearch
MySQL
PostgreSQL, and more.
What are metrics and visualizations in Grafana?
Metrics represent quantifiable data points, while visualizations in Grafana transform these metrics into meaningful charts and graphs. Grafana supports a variety of visual elements, including line graphs, bar charts, heatmaps, and more, providing a comprehensive view of data trends.
What is the difference between Grafana vs Prometheus?
While Grafana and Prometheus often work together, they serve distinct purposes. Prometheus is primarily a monitoring and alerting toolkit, while Grafana is an analytics and visualization platform. Prometheus collects and stores metrics, and Grafana pulls these metrics to create insightful dashboards.
Now, let's do some practical stuff.
Setup grafana in your local environment on AWS EC2.
Now, let's walk through the steps to set up Grafana on a Linux system:
Visit Grafana on Linux
Install prerequisite packages:
sudo apt-get install -y apt-transport-https software-properties-common wget
Import the GPG key:
sudo mkdir -p /etc/apt/keyrings/
wget -q -O - https://apt.grafana.com/gpg.key | gpg --dearmor | sudo tee /etc/apt/keyrings/grafana.gpg > /dev/null
Add a repository for stable releases:
echo "deb [signed-by=/etc/apt/keyrings/grafana.gpg] https://apt.grafana.com stable main" | sudo tee -a /etc/apt/sources.list.d/grafana.list
Update the list of available packages:
sudo apt-get update
Install Grafana OSS:
sudo apt-get install grafana
Enable and start Grafana service:
sudo systemctl enable grafana-server
sudo systemctl start grafana-server
Check the status:
sudo systemctl status grafana-server
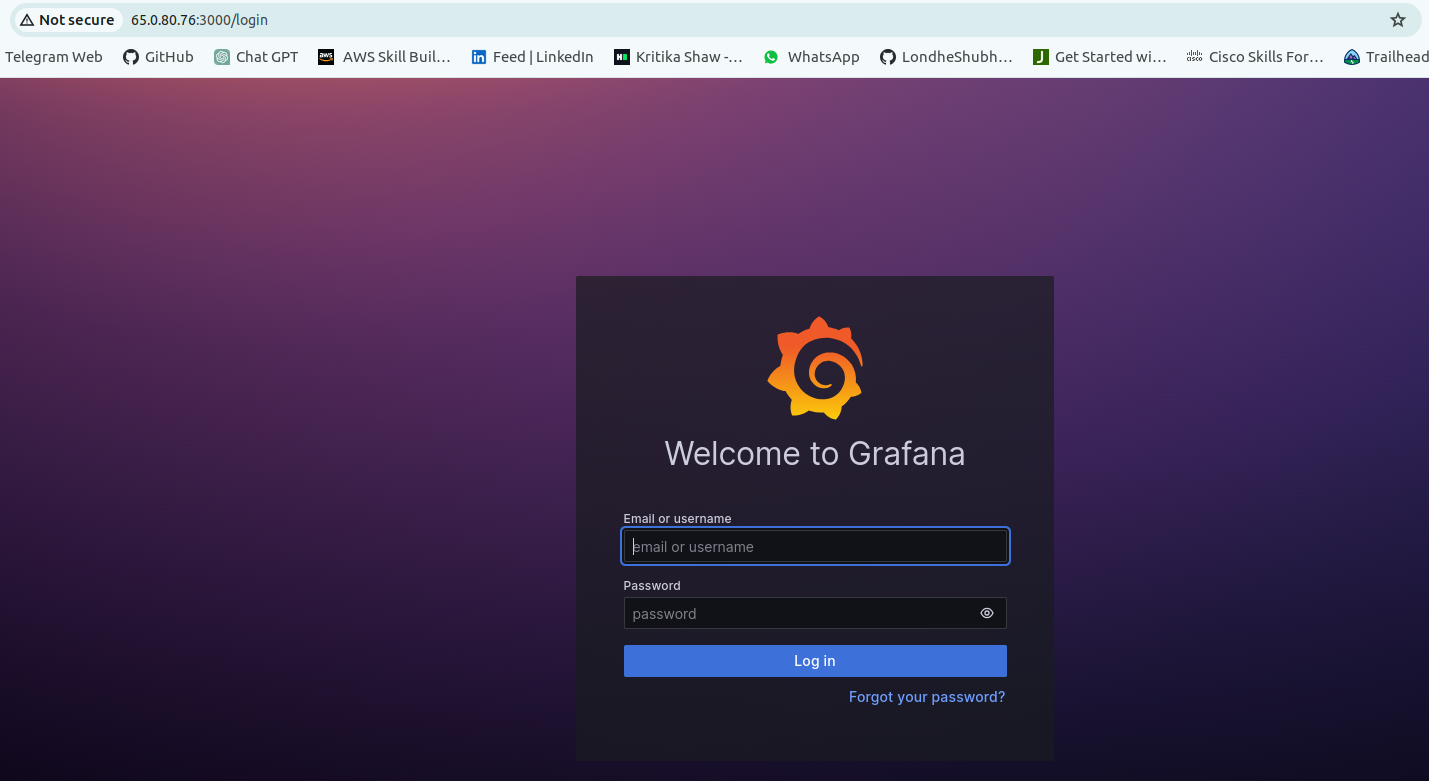
Now launch Grafana by going to <ipaddress>:3000 in your browser. Make sure port 3000 is open in the ec2 instance security group.
Thank you so much for taking the time to read till the end! Hope you found this blog informative and helpful.
Feel free to explore more of my content, and don't hesitate to reach out if need any assistance from me or in case of you have any questions.
Happy Learning!
~kritika :)
Connect with me: LinkedIn


