Day 74 Connecting EC2 with Grafana

🛠️ Exploring DevOps tools: Docker, Kubernetes, Jenkins, Terraform, and more. 🌐Let's connect, learn, and grow together.
Day 74 of #90daysofdevops
Hey Techies! Welcome to this blog
In this blog, we are going to start with Connecting EC2 with Grafana.
Introduction
Monitoring the performance of your server infrastructure is crucial for ensuring optimal operation and identifying potential issues. In this tutorial, we'll explore how to set up Grafana and Prometheus to monitor CPU usage on Ubuntu instances. Grafana provides a powerful visualization interface, while Prometheus collects and stores metrics.
Prerequisites
Before we begin, make sure you have:
Two Ubuntu instances running on your preferred cloud provider (e.g., AWS, Azure).
SSH access to both instances.
Basic knowledge of Ubuntu commands and Prometheus/Grafana.
Step 1: Install Grafana on Ubuntu
sudo apt-get update
sudo apt-get install -y software-properties-common
sudo add-apt-repository "deb https://packages.grafana.com/oss/deb stable main"
wget -q -O - https://packages.grafana.com/gpg.key | sudo apt-key add -
sudo apt-get update
sudo apt-get install -y grafana
sudo systemctl enable grafana-server
sudo systemctl start grafana-server
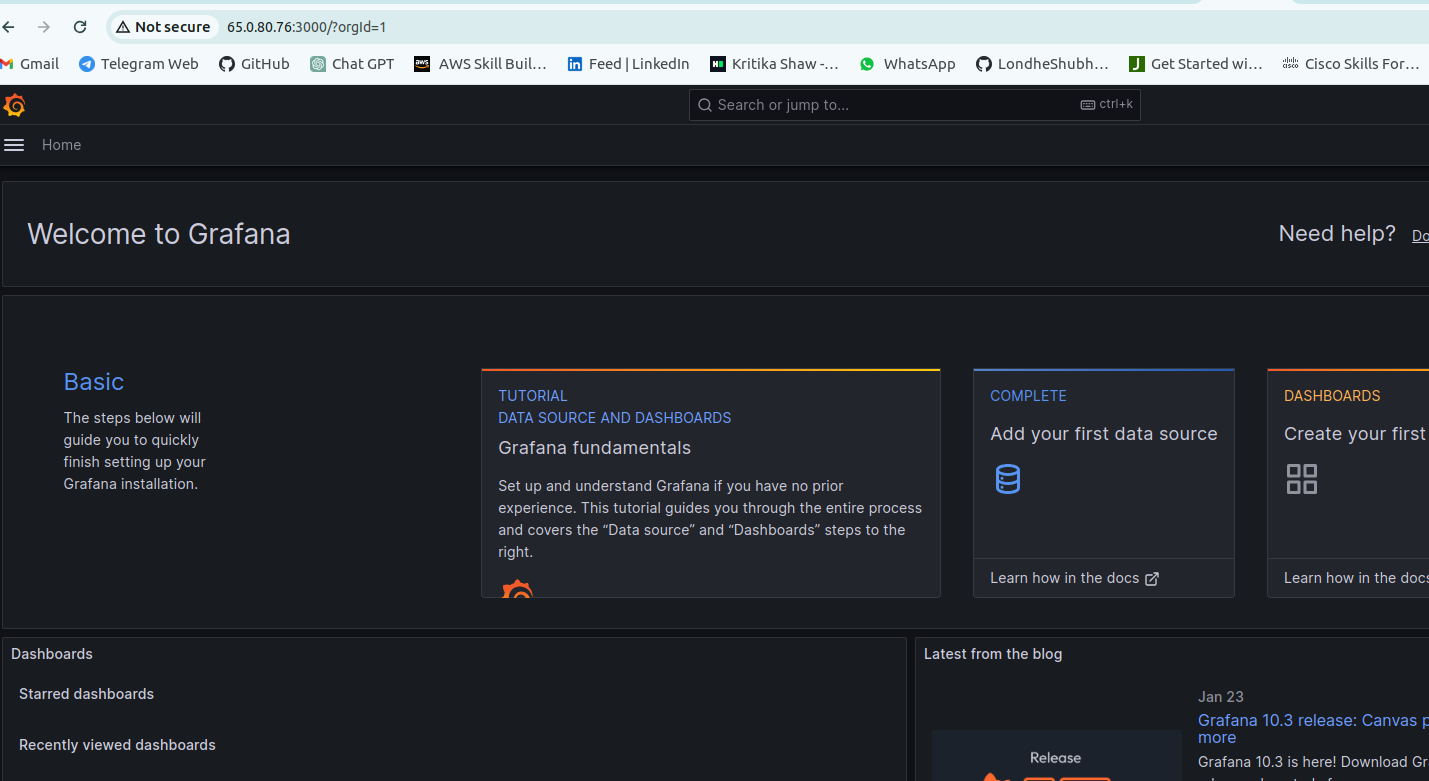
Access Grafana by navigating to http://<your-ubuntu-instance-ip>:3000 in your browser.
Login using default login-id`and password`as admin` and admin` then you can change this default password as you wish.
Step 2: Install Prometheus on the Second Ubuntu Instance
SSH into the second Ubuntu instance:
sudo apt-get update
sudo apt-get install -y prometheus
sudo systemctl enable prometheus
sudo systemctl start prometheus
Access Prometheus by navigating to http://<your-ubuntu-instance-ip>:9090 in your browser.
Step 3: Configure Prometheus Data Source in Grafana
Log in to Grafana.
Go to "Settings" > "Data Sources."
Click "Add your first data source."
Choose "Prometheus" and enter the IP address of the second Ubuntu instance where Prometheus will run.
Step 4: Create CPU Usage Dashboard in Grafana
In Grafana, go to the "+" menu on the left sidebar and choose "Dashboard."
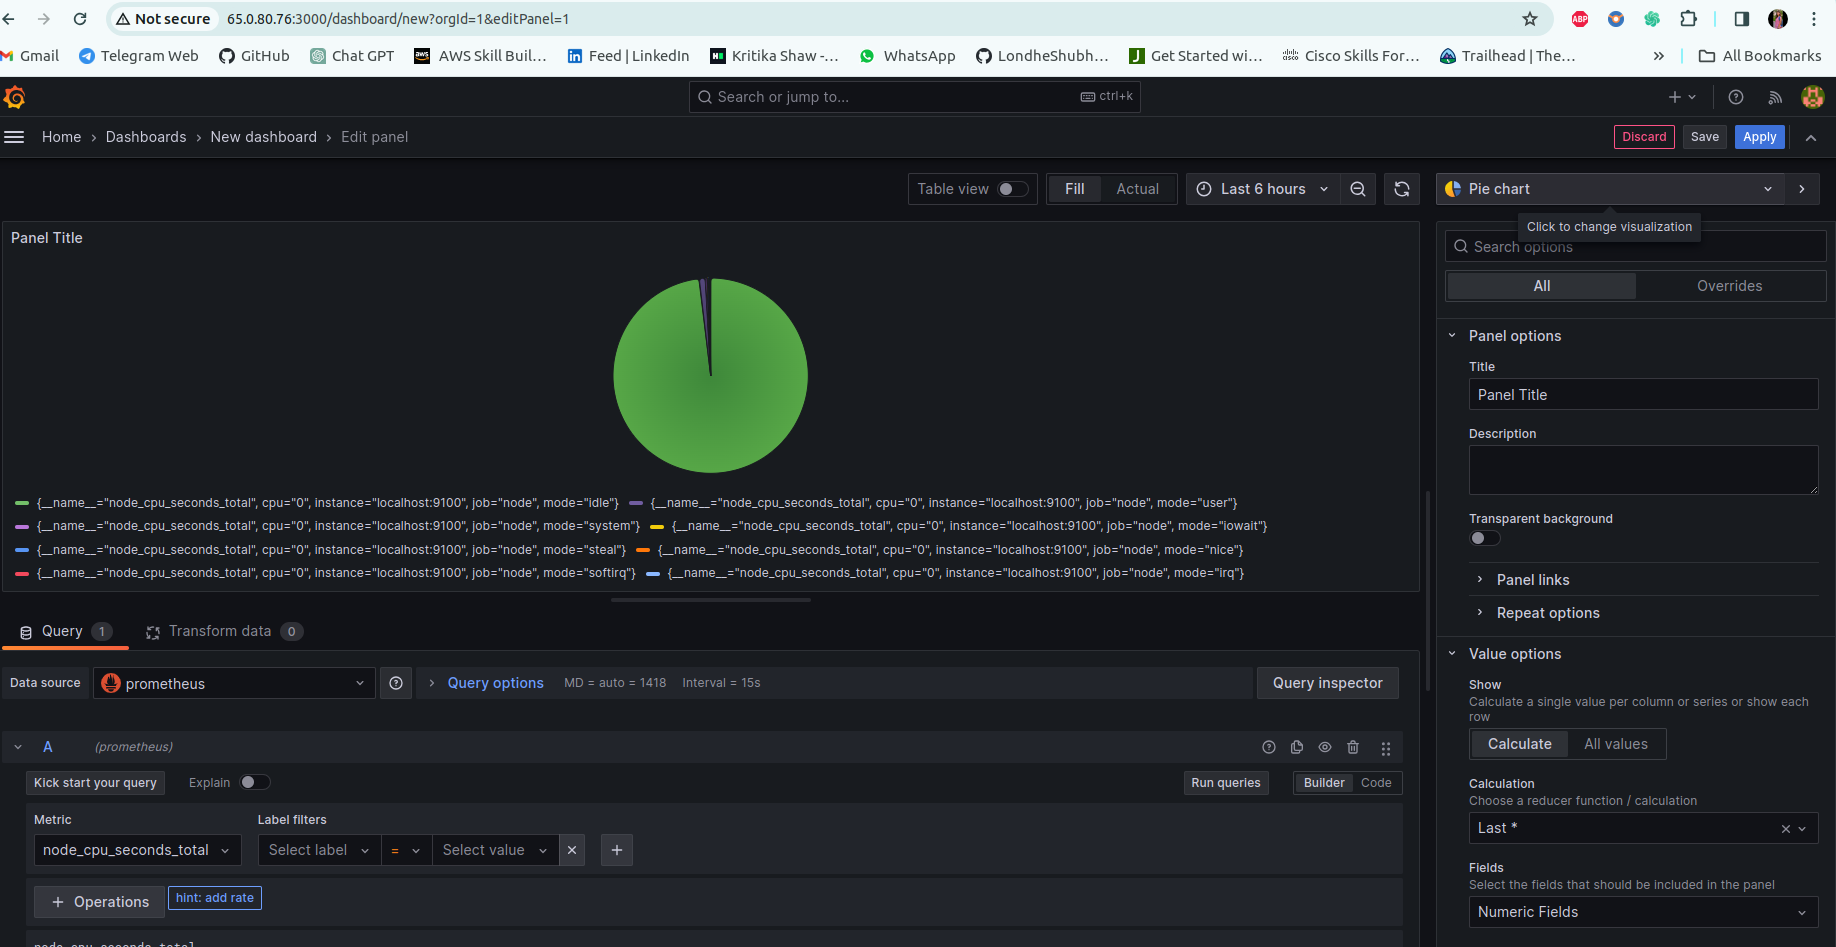
Add a new panel.
Select the Prometheus data source.
Use the following query to monitor user CPU usage:
rate(node_cpu_seconds_total{mode="user"}[1m])Configure visualization settings and save the panel.
Step 5: Explore and Analyze Metrics
Explore the Grafana dashboard to visualize and analyze CPU usage metrics from both Ubuntu instances. Customize panels and queries based on your monitoring requirements.
Thank you so much for taking the time to read till the end! Hope you found this blog informative and helpful.
Feel free to explore more of my content, and don't hesitate to reach out if need any assistance from me or in case of you have any questions.
Happy Learning!
~kritika :)
Connect with me: LinkedIn


