
Day 75 & 76 Monitoring Docker Logs Using Grafana and Prometheus & Build a Grafana dashboard


Day 75 & 76 of #90daysofdevops
Hey Techies! Welcome to this blog
In this blog, we are going to start with Monitoring Docker Logs Using Grafana and Prometheus & Build a Grafana dashboard.
Introduction
In this comprehensive tutorial, we'll guide you through the process of sending Docker logs to Grafana for effective monitoring and visualization. This setup involves launching two EC2 instances, installing Grafana on Instance 1, and Prometheus with Docker on Instance 2. By the end of this guide, you'll have a fully functional Grafana dashboard displaying Docker container metrics.
Prerequisites
AWS account with EC2 instances
Basic knowledge of Linux commands
SSH access to both EC2 instances
Step 1: Launch EC2 Instances
Launch two EC2 instances on AWS, naming them Instance 1 and Instance 2. Ensure you have the necessary security groups, key pairs, and IAM roles configured for smooth communication.
Step 2: Install Grafana on Instance 1
SSH into Instance 1 and install Grafana using the following commands:
sudo apt-get update
sudo apt-get install -y software-properties-common
sudo add-apt-repository "deb https://packages.grafana.com/oss/deb stable main"
wget -q -O - https://packages.grafana.com/gpg.key | sudo apt-key add -
sudo apt-get update
sudo apt-get install -y grafana
sudo systemctl start grafana-server
sudo systemctl enable grafana-server
Access Grafana's web interface by navigating to http://<instance_1_ip>:3000 in your browser.
Login using default login-id`and password`as admin` and admin` then you can change this default password as you wish.
Step 3: Install Prometheus and Docker on Instance 2
SSH into Instance 2 and install Prometheus and Docker:
sudo apt-get update
sudo apt-get install -y prometheus docker.io
Access Prometheus by navigating to http://<your-ubuntu-instance-ip>:9090 in your browser.
Step 4: Configure Docker Metrics Collection
Create a file named daemon.json in /etc/docker/ with the following content:
{
    "metrics-addr": "0.0.0.0:9090",
    "experimental": true
}
Restart Docker:
sudo systemctl restart docker
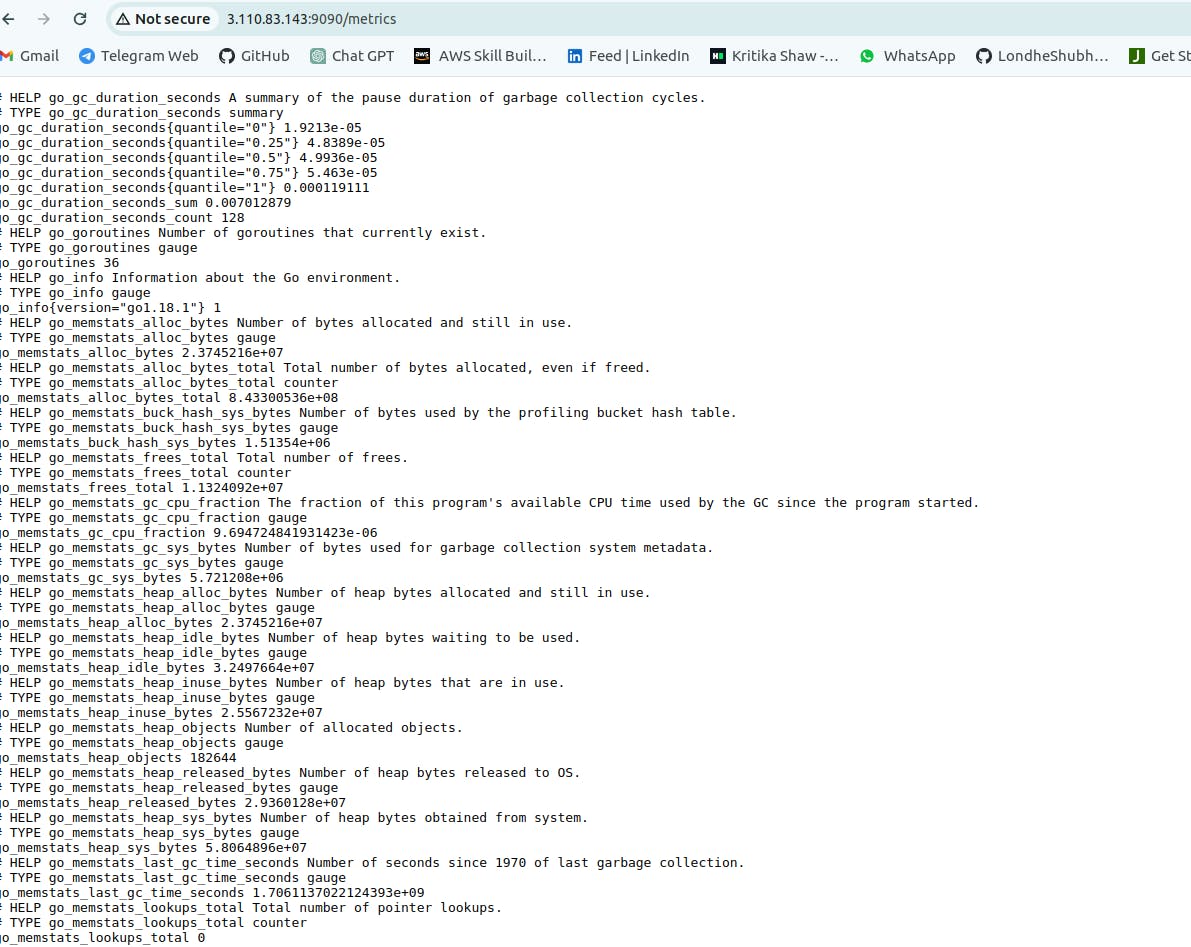
You should now see your docker metrics by going to <instance_2_ip>:9090/metrics.
Step 5: Configure Prometheus for Docker Metrics
Edit the prometheus.yml file in /etc/prometheus/ and add a new job:
- job_name: 'docker_metrics'
  static_configs:
    - targets: ['<instance_2_ip>:9090']
Restart Prometheus:
sudo systemctl restart prometheus
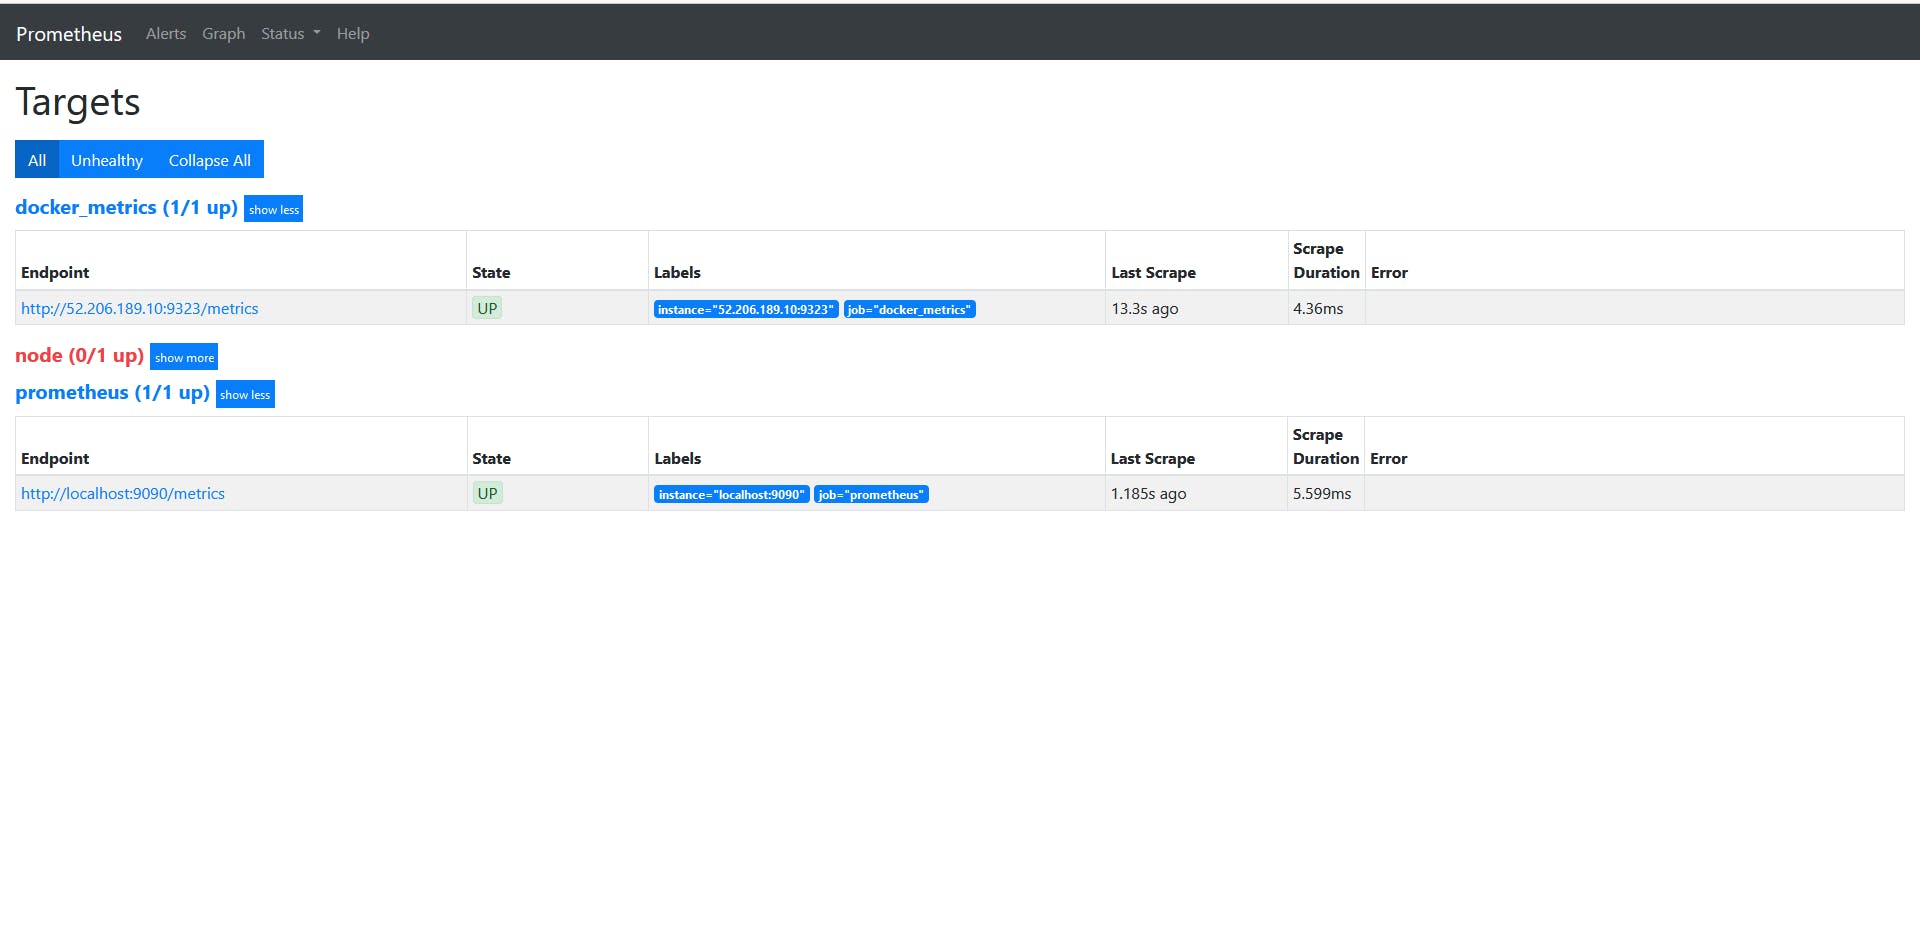
Verify the new job is visible in Prometheus targets.
Step 6: Configure Grafana Data Source
Log in to Grafana.
Navigate to "Settings" > "Data Sources."
Click "Add your first data source" and select Prometheus.
Set the URL to
<instance_2_ip>:9090and click "Save & Test."
Step 7: Create Grafana Dashboard
Go to the "+" icon on the left sidebar and select "Dashboard."
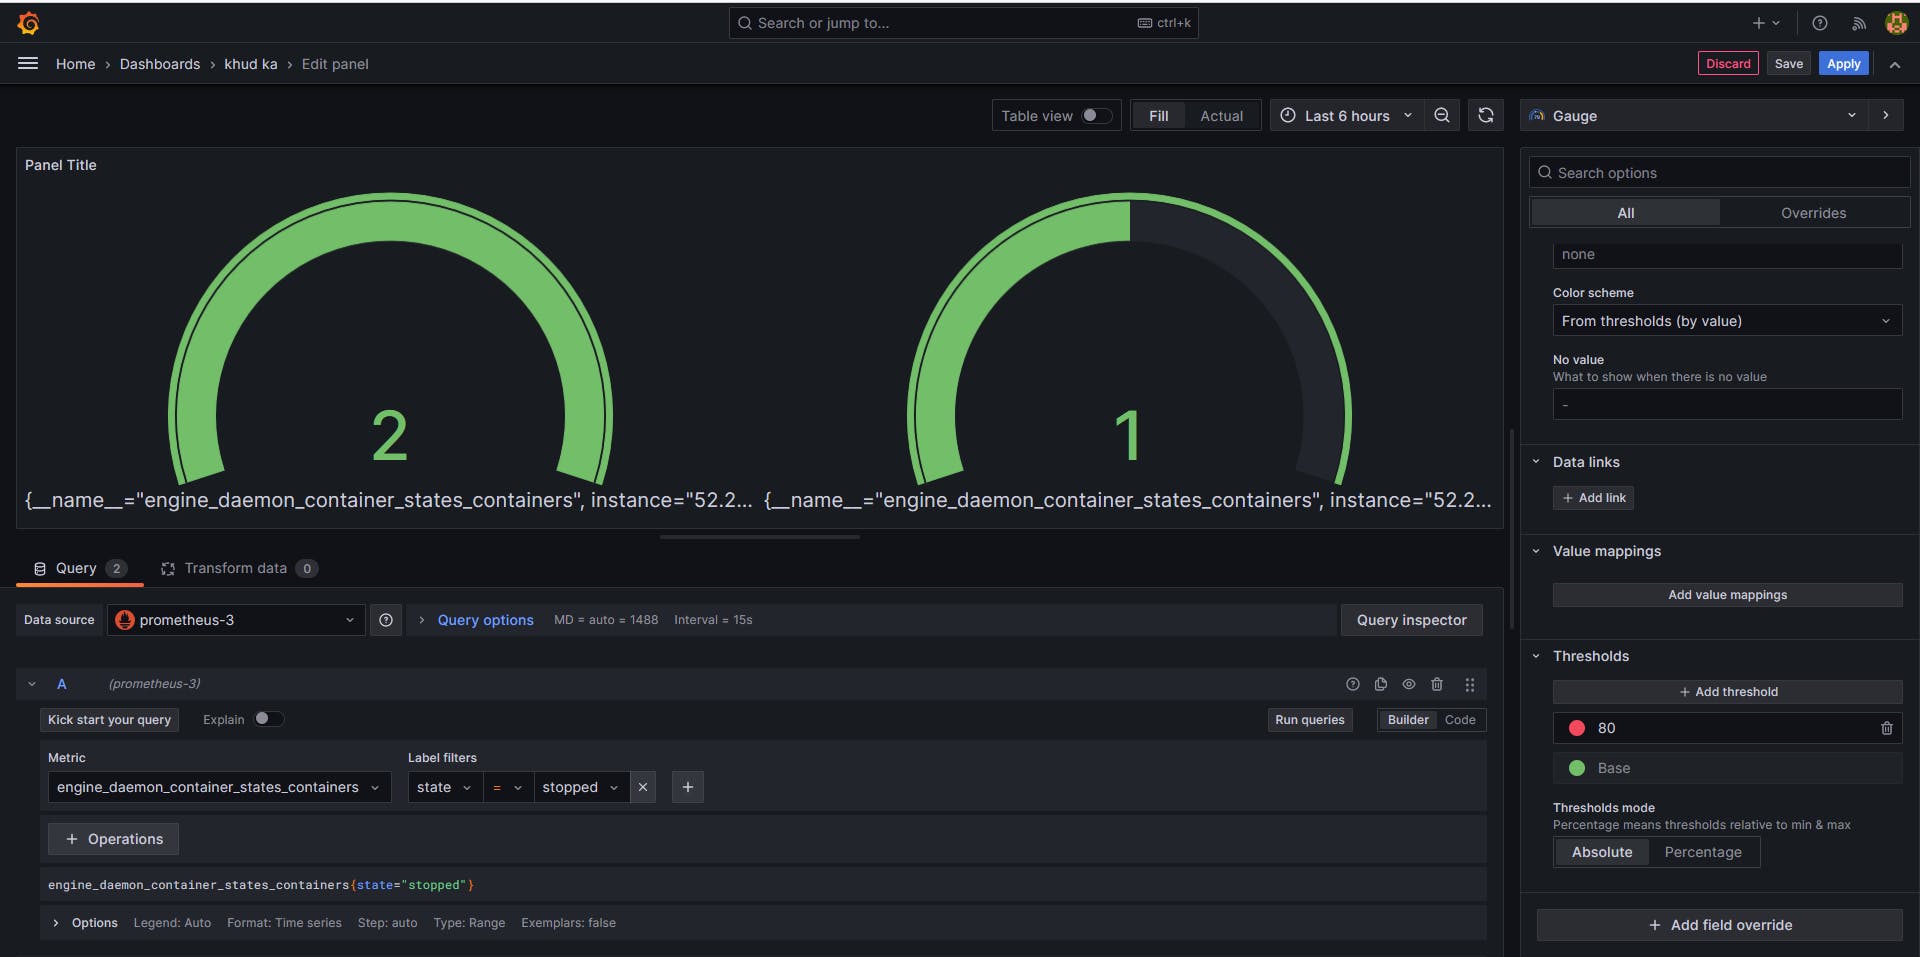
Click "Add new panel" and choose Prometheus as the data source.
Use the sample query:
engine_daemon_container_states_containers{state="running"}Customize the panel and dashboard as needed.
Thank you so much for taking the time to read till the end! Hope you found this blog informative and helpful.
Feel free to explore more of my content, and don't hesitate to reach out if need any assistance from me or in case of you have any questions.
Happy Learning!
~kritika :)
Connect with me: LinkedIn