Day 77 Grafana Alerting

🛠️ Exploring DevOps tools: Docker, Kubernetes, Jenkins, Terraform, and more. 🌐Let's connect, learn, and grow together.
Day 77 of #90daysofdevops
Hey Techies! Welcome to this blog
In this blog, we are going to start with Grafana Alerting.
Grafana Alerting allows you to learn about problems in your systems moments after they occur. Create, manage, and take action on your alerts in a single, consolidated view, and improve your team’s ability to identify and resolve issues quickly.
Grafana Alerting is available for Grafana OSS, Grafana Enterprise, or Grafana Cloud. With Mimir and Loki alert rules you can run alert expressions closer to your data and at massive scale, all managed by the Grafana UI you are already familiar with.
Task
Setup Grafana Cloud
Grafana Cloud
Grafana cloud, developed by Grafana Labs, is a comprehensive observablity platform hosted in the cloud. It offers a range of monitoring,virtualisation and alerting tools and services. By utilising Grafana cloud organizations can effectively monitor and gain valuable insights into their systems, applications and infrastructure.
Key Features of Grafana Cloud include:
1. Centralized Platform: Grafana Cloud provides a user-friendly web-based interface for configuration, visualization and analysis of metrics,logs and traces all in one place.
2. Metrics Monitoring: Grafana cloud supports the collection, storage and visualization of metrics using the Prmetheus monitoring system. It empowers users to create customized dashboards,graphs and alerts based on their metrics data.
3. Log Aggregation: With the integrated Loki log system, Grafana Cloud enables efficient collection,storage and real time querying of log data. This facilitates troubleshooting and analysis of logs to identify and resolve issues promptly.
4. Distributed Tracing: Grafana Cloud incorporates Tempo a distributed tracing system. It captures and analyzes distributed traces,providing insights into system performance and behavior.
5. Alerting and Notifications: Grafana Cloud offers rpbust alerting capabilities allowing users to set up customized alerts based on metric thresholds, log patterns or trace spans. Notification can be sent via various channels such as email, PageDuty and Slack.
6. Data Source Integrations: Grafana Cloud seamlessly integrates with various data sources,including Prometheus,Loki Graphite,InfluxDB and Elasticsearch. This integration allows users to consolidate data from multiple sources and create unified dashboards and visualizations.
7. Collabration and Multi-tenancy: Grafana Cloud supports multi-tenancy,enabling organizations to create seperate spaces,teams,and permissions for different projects or departments. it also facilitates collabration by enabling users to share dashboards and work together on monitoring configurations.
8. Scalability and Reliability: Built to handle large volumes of data Grafana Cloud offers scalability options to accomodate growing organizations. It ensures data durability and avaliability through robust storage,replication and backup mechanisms.
By Leveraging the capabilities of Grafana cloud, organizations can gain valuable insights into their systems identify performance issues, troubleshoot effectively and make data-driven decesions to optimize the reliability and efficiency of their applications and infrastructure.
Grafana Alerting:
Grafana Alerting allows you to learn about problems in your systems moments after they occur, Create,manage and take actions on your alerts in a single, consolidated view and improve your teams ability to identify and resolved issues wuickly.
Grafana Alerting is available for Grafana OSS, Grafana Enterprise or Grafana Cloud. With Mimir and Loki alert rules you can run alert expressions closer to your data and at a massive scale all managed by the Grafana UI you are already familiar with.
Prerequisites
Before you begin, make sure you have the following components set up:
Prometheus: Ensure that Prometheus is installed and configured to scrape Docker metrics. Prometheus will act as the data source for Grafana.
Grafana: Install Grafana on your system and configure Prometheus as a data source. This is usually done by specifying Prometheus URL in Grafana's data source settings.
I have covered everything in this Blog.
Step 1: Accessing Grafana Dashboard
Open your web browser and navigate to your Grafana instance.
Log in to Grafana using your credentials.
Step 2: Adding Prometheus Data Source
In the Grafana dashboard, click on the gear icon on the left sidebar to open the "Settings" menu.
Select "Data Sources" and click on the "Add your first data source" button.
Choose Prometheus from the list of available data sources.
Configure the Prometheus data source by providing the URL and any required authentication details.
Click "Save & Test" to verify the connection to Prometheus.
Step 3: Creating a Docker Containers Panel
Return to the Grafana dashboard and click the "+" icon on the left sidebar to add a new panel.
Choose Prometheus as the data source.
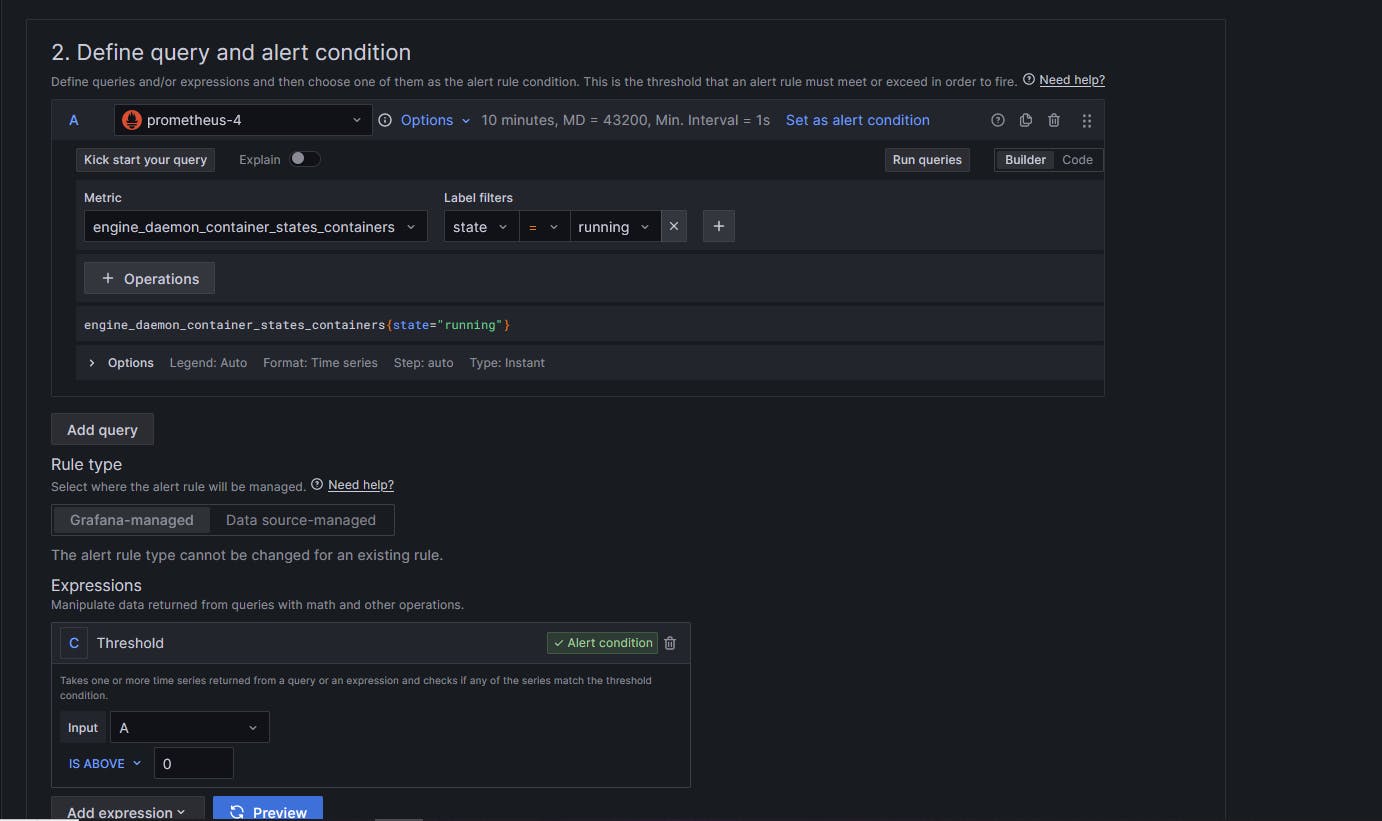
Write a PromQL query to retrieve the number of Docker containers. For example, the query could be
engine_daemon_container_states_containers{state="running"}.Customize the panel as needed, adjusting visualization options and labels.
Save the panel by clicking "Apply" or "Save Dashboard" at the top.
Step 4: Setting Up Alerts
With the Docker Containers panel selected, click on the panel title and choose "Edit."
In the panel editor, navigate to the "Alert" tab.
Click on "Create Alert."
Configure the conditions for the alert. In this case, set the condition to trigger when the "Value is greater than 0."
Specify the alert details, such as the name, message, and severity.
Set up notification channels (e.g., email, Slack, etc.) in the "Notifications" tab.
Click "Apply" or "Save Dashboard" to save the changes.
Step 5: Testing the Alert
To test the alert, intentionally create a situation where the number of Docker containers is greater than 0. This could involve starting a Docker container.
Monitor the Grafana dashboard for the alert status.
Verify that notifications are sent to the configured channels.
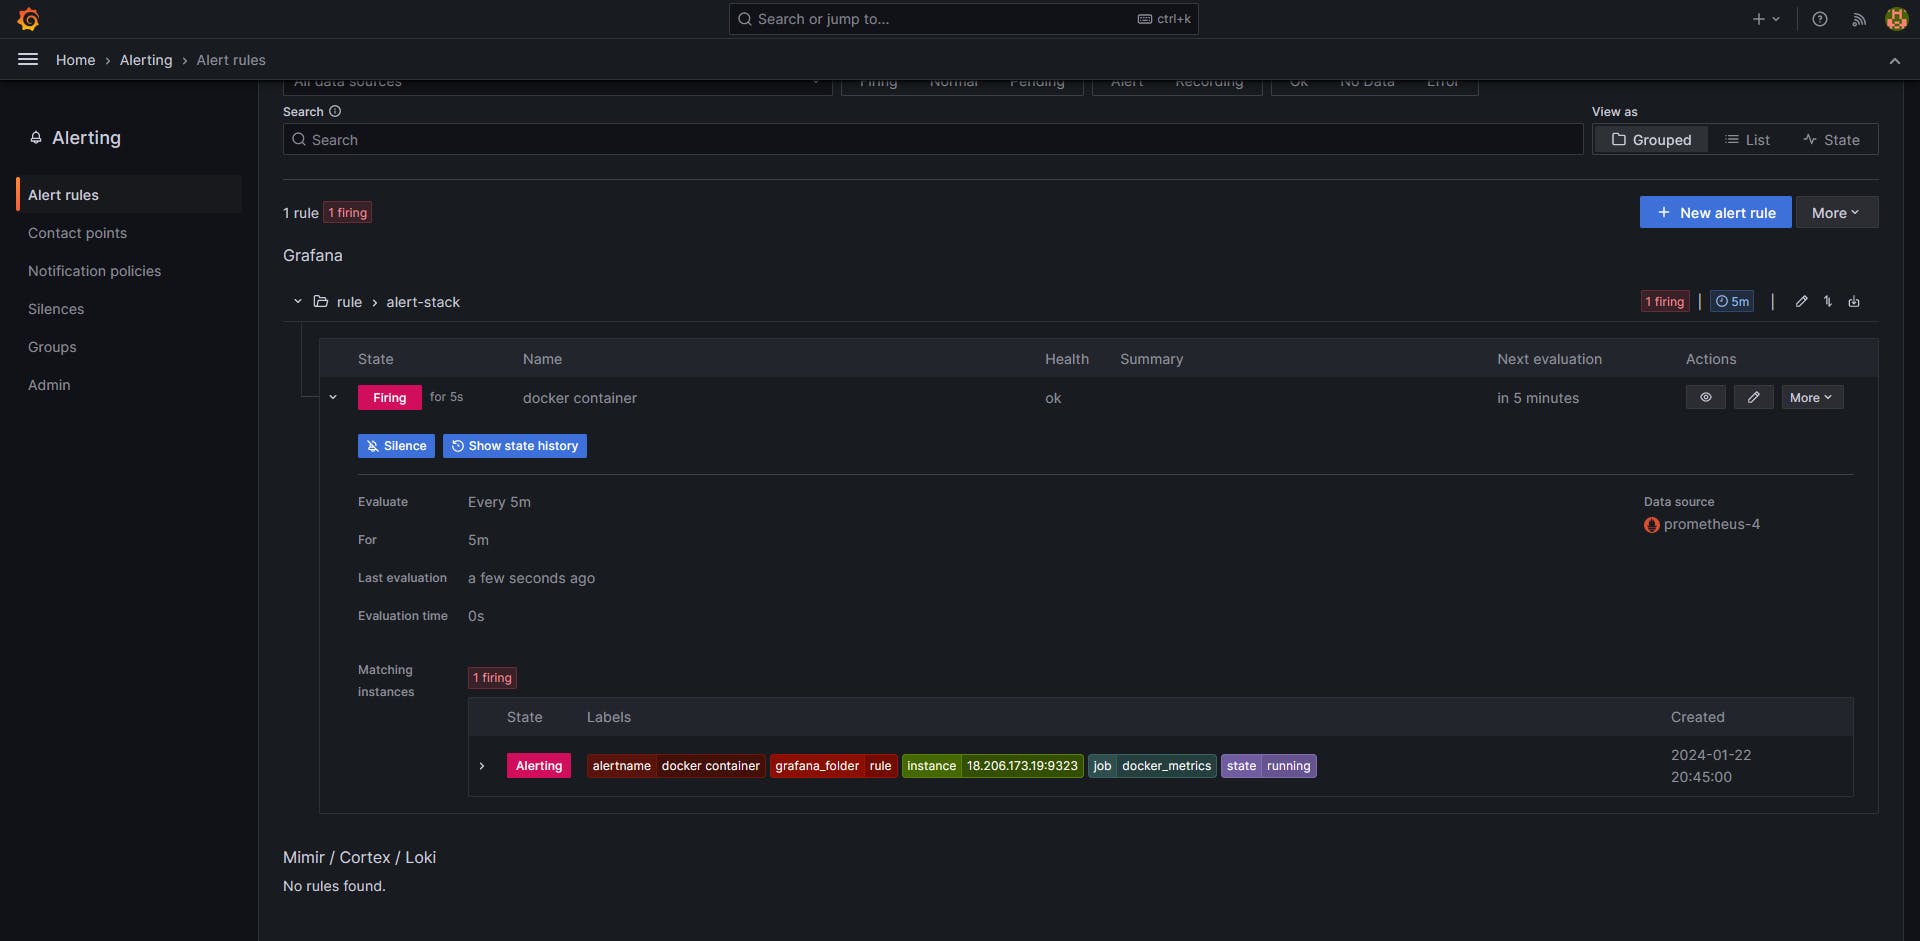
Congratulations! You have successfully set up alerting in Grafana based on Docker container metrics from Prometheus. This ensures that you are promptly notified whenever the number of Docker containers exceeds the defined threshold.
Thank you so much for taking the time to read till the end! Hope you found this blog informative and helpful.
Feel free to explore more of my content, and don't hesitate to reach out if need any assistance from me or in case of you have any questions.
Happy Learning!
~kritika :)
Connect with me: LinkedIn


